DB Glossary
Table of Contents:
Exadata
ADB
Exadata (https://www.oracle.com/technetwork/database/exadata/exadata-dbmachine-x4-twp-2076451.pdf)
·
Real
Application Cluster (https://logicalread.com/oracle-12c-rac-mc05/#.W_XWE5NKjUo) (https://www.oracle.com/technetwork/database/options/clustering/overview/index-086583.html)
o
Oracle
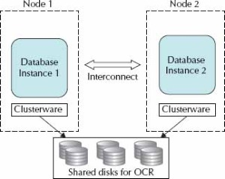
Real Application Clusters (RAC) provides a database environment that is highly
available as well as scalable. If a server in the cluster fails, the database
instance will continue to run on the remaining servers or nodes in the cluster.
With Oracle Clusterware, implementing a new cluster
node is made simple. RAC provides possibilities for scaling applications
further than the resources of a single server, which means that the environment
can start with what is currently needed and then servers can be added as
necessary.
o
A
typical RAC environment has a set of disks that are shared by all servers; each
server has at least two network ports: one for outside connections and one for
the interconnect (the private network between nodes and a
cluster manager).
o
The
shared disk for the clusterware comprises two
components: a voting disk for recording disk membership and an Oracle Cluster
Registry (OCR), which contains the cluster configurations. The voting disk needs
to be shared and can be raw devices, Oracle Cluster File System files, ASM, or
NTFS partitions. The Oracle Clusterware is the key
piece that allows all of the servers to operate together.
o
·
Smart
Scan (https://www.oracle.com/technetwork/testcontent/o31exadata-354069.html)
o
A
database index is a data structure that improves the speed of data retrieval
operations on a database table at the cost of additional writes and storage
space to maintain the index data structure.
o
Database
indexes are used to quickly locate data without having to search every row in a
database table every time a database table is accessed. It can be created using
one or more columns of a database table, providing the basis for both rapid
random lookups and efficient access of ordered records. It is a copy of selected columns of data
from a table that can be searched very efficiently that also includes a
low-level disk block address or direct link to the complete row of data it was
copied from.
o
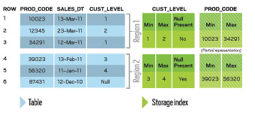
A
storage index is
an in-memory
structure that holds
some information about
the data inside
specified regions of
physical storage. This
information tells the
storage cell which
areas of the
disk do not contain the
values the query
is interested in,
so those areas
are not accessed
during a scan.
o
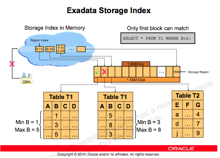
Storage indexes in Oracle Exadata know the distribution of data in storage cells and help eliminate physical I/O within storage cells during a smart scan. This significant reduction in I/O results in even faster processing of data within the Oracle Exadata Database Machine. You can check to see whether storage indexes are being used in Oracle Exadata queries, and you can measure the I/O savings in a specific query.
o
Storage
in Oracle Exadata changes
query processing so
that not all
blocks have to
go to the
database server for
that server to
determine which rows
might satisfy a
query. Oracle Exadata’s
Smart Scan feature
enables certain types
of query processing to
be done in
the storage cell.
With Smart Scan
technology, the database
nodes send query
details to the
storage cells via
a protocol known
as iDB (Intelligent Database).
With this information, the
storage cells can
take over a
large portion of
the data-intensive
query processing. Oracle
Exadata storage
cells can search
storage disks with
added intelligence about
the query and
send only the
relevant bytes, not
all the database
blocks, to the
database nodes—hence
the term smart scan.
o
·
Infiniband
Scale-Out (https://centroid.com/infiniband-oracle-engineered-systems-exalogic-and-exadata/)
o
InfiniBand is a type of communications
link for data flow between processors and I/O devices that offers throughput of
up to 2.5 gigabytes per second and support for up to 64,000 addressable
devices. Because it is also scalable and
supports quality of service (QoS) and failover,
InfiniBand is often used as a server connect in high-performance computing (HPC)
environments. (https://searchstorage.techtarget.com/definition/InfiniBand)
o
Oracle made changes to Oracle
Enterprise Linux UEK kernel and Oracle binaries to utilize RDS protocol over IB
instead of traditional TCP/IP or UDP over Ethernet. This enabled them to avoid
unnecessary CPU overhead of processing Ethernet TCP/IP or UDP packets in Kernel
and achieve the ubiquitous holy grail of RDMA on low-latency high-bandwidth IB
fabric, which is still faster than newer technologies being built around
Ethernet infrastructure like RoCE (http://blog.infinibandta.org/2012/02/13/roce-and-infiniband-which-should-i-choose/).
In engineered systems, presenting the entire Rack whether one-eight/quarter or
half/full, totally encapsulated with compute, storage and IB network backplane,
has made it easier for Datacenter managers to adopt IB based solution by just
plug-n-play.
o
In a typical datacenter, compute
nodes will be bundled together on standard network backbones like 10GigE or
Fiber Chanel Fabric for Storage. They typically suffer when they have to scale
out to accommodate ever-increasing demands of applications. In large compute
intensive systems, network I/O ends up being a huge bottleneck for application
performance and is a major impediment in horizontal scaling using technologies
like application clustering. Exalogic was designed
specially to answer this shortcoming. Similar to utilization of RDS in Exadata, in Exalogic some of the
software components (OS and applications) make use of a protocol known as
Sockets Direct Protocol, which enables kernel bypass, eliminates buffer copies
and uses larger 64bytes packets that reduces network overhead. In general, Infiniband provides over three times the throughput of 10
GigE and get 50% less latency using native SDP.
o
Exalogic
configured with Exadata is complete high-performance
compute and storage solution wholly encapsulated in Racks. By utilizing high
bandwidth low-latency IB backplane for internal communication between
components in a Rack and exposing 10GigE NICs which can be easily be plugged
into existing an Datacenter network infrastructure,
Oracle has made it easier for customers to adopt all the benefits that IB has
to offer without having to worry about setting separate IB fabric in their
Datacenter.
·
Database Aware Smart Flash Cache (http://www.informit.com/articles/article.aspx?p=2418151&seqNum=3)
(more here https://www.oracle.com/technetwork/database/availability/databaseawareflash-2030367.pdf)
o
The Database Flash Cache serves as a
secondary cache to the Oracle buffer cache. Oracle manages data blocks in the
buffer cache using a modified least recently used (LRU) algorithm.
Simplistically speaking, blocks age out of the buffer cache if they have not
been accessed recently. When the DBFC is present, blocks that age out of the
data cache are not discarded but are instead written (by the Database Writer,
DBWR) to the Flash device. Should the blocks be required in the future, they
can be read from the Flash Cache instead of from slower magnetic-disk-based
database files.
o
The ESFC is managed by the Exadata Storage Cell Server software CELLSRV.
In general, when a Database Node requests a block of data from an ASM disk, the
CELLSRV software issues asynchronous requests to the ESFC and to the grid disks
that underlie the ASM disk group. If the data is in the Flash Cache, this is
satisfied from the cache, and if not, from the grid disk. After forwarding the
block to the Database Node, CELLSRV then stores any blocks retrieved from the
grid disks into the Flash Cache—provided that the blocks are “eligible.”
o
Eligibility for caching is
determined by metadata sent to the Storage Cell by the database server. This
includes the size and type of I/O, as well as the
segment’s CELL_FLASH_CACHE storage clause.
o
SSD provides far greater I/O
capacity and far lower I/O latencies than traditional magnetic disk.
o
The default configuration for Exadata Flash SSD is as in the Exadata
Smart Flash Cache. The primary purpose of the Exadata
Smart Flash Cache is to accelerate read I/O for database files by configuring
Flash as a cache over the grid disks that service data file read I/O. By default the Exadata Smart Flash
Cache does not accelerate Smart or full table scans, but you can
configure CELL_FLASH_CACHE KEEP to alter this behavior.
o
Exadata
Smart Flash Logging allows the Flash Cache to participate in redo log write
operations. This helps alleviate the occasional very high redo write
“outliers.”
o
The Exadata
Smart Flash Cache can also operate as a write-back cache, allowing it to
satisfy write requests as well as read requests; this can improve performance
on systems that are experiencing data file write I/O bottlenecks—as -evidenced
by free buffer waits.
·
Storage Indexes (refer to Smart Scan
link) (https://centroid.com/exadata-storage-indexes/)
o
A storage index is a memory-based
structure that reduces the amount of physical IO required by the cell. A
storage index keeps track of minimum and maximum values from query predicates
and builds storage index regions based on usage.
o
·
Hybrid Columnar Data (https://logicalread.com/oracle-11g-hybrid-columnar-compression-mc02/#.W_SQYZNKjUo)
(more on https://www.oracle.com/technetwork/database/features/availability/311358-132337.pdf)
o
Hybrid Columnar Compression (HCC),
also known as Exadata Hybrid Columnar Compression
(EHCC), is data that is organized by a hybrid of columns/rows and compressed
versus data organized by basic row format. A performance gain anywhere from
10×to 30× is common. The tables are organized in compression units (CU), which
contain around 1000 rows (more or less depending on the amount of data in the
rows). CUs span many blocks. HCC is very good for bulk-loaded data, but is not
built for OLTP or single block read operations. It is primarily built for data
warehouses and queried data, not for frequently updated data.
·
I/O Priorities(https://docs.oracle.com/en/engineered-systems/exadata-database-machine/sagug/exadata-storage-server-iorm.html#GUID-CF1C0C2A-7E10-4DB6-8A2B-F217BD1FEC21)
o
Storage is often shared by multiple
types of workloads and databases. Shared storage has several benefits over
dedicated storage. One benefit is that sharing lowers administration costs by
reducing the number of storage systems that need to be maintained. Another
benefit is that sharing leads to much more efficient use of storage, both from
a space and a bandwidth standpoint. When a storage system is dedicated to a
single database, the administrator must size the storage system based on the
database's peak anticipated load and size. This practice leads to unused I/O
bandwidth and space for some databases and, if the estimate was not large
enough, then there is insufficient bandwidth and space for other databases. The
correct balance of storage resources across the multiple databases is seldom
achieved because real world workloads are very dynamic.
o
On the other hand, running multiple
types of workloads and databases on shared storage often leads to performance
problems. For example, large parallel queries on one production data warehouse
can impact the performance of critical queries on another production data
warehouse. Also, a data load on a data warehouse can impact the performance of
critical queries also running on it. You can mitigate these problems by
over-provisioning the storage system, but this diminishes the cost-savings
benefit of shared storage. You can also schedule non-critical tasks at off-peak
hours, but this manual process is laborious. It becomes impossible when
databases have different administrators who do not coordinate their activities.
o
I/O Resource Management allows
workloads and databases to share Oracle Exadata
Storage Servers according to user-defined policies. To manage workloads within
a database, you can define database resource plans, using Database Resource
Manager which has been enhanced to manage Oracle Exadata
Storage Server I/O resources. To manage workloads in a container database
(CDB), define a CDB resource plan that allows management for the various
pluggable databases. To manage multiple databases, you can define interdatabase plans.
o
Flash I/O Resource Management
protects the latency of critical OLTP I/O requests in flash cache. When table
scans are running on flash concurrently with OLTP I/O requests, the OLTP
latency is impacted significantly. Flash IORM queues and throttles the table
scan, and other low priority I/O requests. The critical OLTP I/O requests are
never queued. When the flash disks are not busy serving critical OLTP I/O
requests, the queued I/O requests are issued based on the resource allocations
in the interdatabase plan.
·
Offloading (http://kerryosborne.oracle-guy.com/papers/Understanding%20Exadata%20Offloading.pdf)
o
Data Mining Offload (https://www.oracle.com/technetwork/database/options/odm/data-mining-overview-demo11gr2-160023.pdf)
§
Data mining scoring executed in Exadata:
·
select cust_id
from customers where region = ‘US’ and prediction_probability(churnmod, ‘Y’ using *) > 0.8;
§
All scoring functions offloaded to Exadata
§
Benefits
·
Reduces data returned from Exadata to Database server
·
Reduces CPU utilization on Database
Server
·
Up to 10x performance gains
o Offload
Decryption (Oracle Essentials: Oracle
Database 12c)
§
Faster querying of fully encrypted
databases is possible because decryption processing is moved into the
processors in the Exadata Storage Server cells
§
Transparent Data Encryption: data
sent to the database is encrypted by Oracle, and data requested from the
database is decrypted.
o
JSON and XML offload (https://odieweblog.wordpress.com/)
§
Done in storage server
·
Network Resource Mgmt
(refer to top link)
o
Exadata
also implements unique database network resource management to ensure that
network intensive workloads such as reporting, batch, and backups don’t stall
response time sensitive interactive workloads. Latency sensitive network
operations such as RAC Cache Fusion communication and Log File Writes are
automatically moved to the head of the message queue in server and storage
network cards as well as InfiniBand network switches, bypassing any nonlatency sensitive messages. Latency critical messages
even jump ahead of non-latency critical messages that have already been
partially sent across the network, ensuring low response times even in the
presence of large network DMA operations.
·
Prioritized File Recovery (https://docs.sdbor.edu/oracle/db12cr2/oracle-database_12.2_20180511/content/haovw/ha-features.html#GUID-314F15CE-BD8F-45B0-911E-B7FCC2B8006A)
o
Database optimized availability
allows for prioritized recovery of critical database files
o
Oracle Automatic Storage Management:
For optimal performance, Oracle ASM spreads files across all available storage.
To protect against data loss, Oracle ASM extends the concept of SAME (stripe
and mirror everything) and adds more flexibility because it can mirror at the
database file level rather than at the entire disk level.
More
important, Oracle ASM simplifies the processes of setting up mirroring, adding
disks, and removing disks. Instead of managing hundreds or possibly thousands
of files (as in a large data warehouse), database administrators using Oracle
ASM create and administer a larger-grained object called a disk group.
The disk group identifies the set of disks that are managed as a logical unit.
Automation of file naming and placement of the underlying database files save
administrators time and ensure adherence to standard best practices.
The
Oracle ASM native mirroring mechanism (two-way or three-way) protects against
storage failures. With Oracle ASM mirroring, you can provide an additional
level of data protection with the use of failure groups. A failure
group is a set of disks sharing a common resource (disk controller or
an entire disk array) whose failure can be tolerated. After it is defined, an
Oracle ASM failure group intelligently places redundant copies of the data in
separate failure groups. This ensures that the data is available and
transparently protected against the failure of any component in the storage
subsystem.
o
Fast Recovery Area: the fast
recovery area is a unified storage location for all recovery-related
files and activities in Oracle Database. After this feature is enabled, all
RMAN backups, archived redo log files, control file autobackups,
flashback logs, and data file copies are automatically written to a specified
file system or Oracle ASM disk group, and the management of this disk space is
handled by RMAN and the database server.
Performing
a backup to disk is faster because using the fast recovery area eliminates the
bottleneck of writing to tape. More important, if database media recovery is
required, then data file backups are readily available. Restoration and
recovery time is reduced because you do not need to find a tape and a free tape
device to restore the needed data files and archived redo log files.
·
Direct-to-wire Protocol (https://www.linkedin.com/pulse/what-exafusion-direct-wire-oltp-protocol-lukasz-feldman/)
(http://nnawaz.blogspot.com/2016/03/exadata-exafusion.html)
o
ExaFusion
Direct to Wire OLTP Protocol reimplements the RAC
Cache Fusion with the bypass of the networking software stack, interrupts and
scheduling.
o
ExaFusion
allows database processes to read and send Oracle Real Applications Cluster
(Oracle RAC) messages directly over the Infiniband
network bypassing the overhead of entering the OS kernel, and running the
normal networking software stack. This improves the response time and
scalability of the Oracle RAC environment on Oracle Exadata
Database Machine. Data is transferred directly from user space to the Infiniband network, leading to reduced CPU utilization and
better scale-out performance. Exafusion is especially
useful for OLTP applications because per message overhead is particularly
apparent in small OLTP messages. Exafusion helps
small messages by bypassing OS network layer overhead and is ideal for this
purpose.
·
Instant failure detection (https://www.oracle.com/technetwork/database/availability/exadata-maa-3605537.pdf)
o
Unique Brownout Reduction Features:
If a server disappears from both InfiniBand switches, declare it dead in less
than two seconds
o
No waiting for long heartbeat
timeouts – Reduces application brownouts from 30+ seconds to < 2 seconds
·
In-Memory Columnar in Flash (https://blogs.oracle.com/in-memory/columnar-formats-in-exadata-flash-cache)
o
It is the ability to transform
Hybrid Columnar Compressed (HCC) data into a pure columnar format in the flash
cache. The process to accomplish this rearranges 1 MB worth of HCC
data into a true columnar form and stores the page mapping in the flash
cache's hash table to tell us where the columns are. It is not uncommon to see
a savings of 50-80% disk I/O from the columnar cache and significant
improvements to the wall clock for queries which are cell CPU bound.
o
Depending on the configuration of
environment, the data from eligible scans will be automatically cached in the
flash cache in one of the columnar formats.
·
Smart Fusion Block Transfer (http://blog.umairmansoob.com/tag/exadata-smart-fusion-block-transfer/)
o
If you have an OLTP application
running on Exadata and frequently updating to adding
rows to tables from multiple database blocks, you can take advantage of Smart
Fusion Block Transfer capability which uniquely improves performance of a RAC
configuration by eliminating the impact of redo log write latency. Especially
DML queries running from multiple instances, can lead to hot blocks transfer
between Oracle RAC Nodes. This feature can transfer hots blocks as soon as the
I/O to the redo log is issued at the sending node, without waiting for it to
complete. As per Oracle “It has been observed that Smart Block Transfer
increases throughput (about 40% higher) and decreases response times (about 33%
less) for communication intensive workloads”.
o
Without Exadata’s
Smart Fusion Block Transfer feature, a hot block can be transferred from a
sending node to a receiver node only after the sending node has made changes in
its redo log buffer durable in its redo log. With Smart Fusion Block Transfer,
this latency of redo log write at the sending node is eliminated.
·
Exadata
Cloud Service (https://cloud.oracle.com/en_US/database/exadata/features)
Autonomous DB
*9i
·
Automatic
Query Rewrite (https://docs.oracle.com/cd/B10501_01/server.920/a96520/qr.htm)
o
Automatic
query rewriting solutions allow you to significantly shorten the execution time
of complex queries in complex systems, data warehouses and analytical
environments.
o
One
of the major benefits of creating and maintaining materialized views is the
ability to take advantage of query rewrite, which transforms a SQL statement
expressed in terms of tables or views into a statement accessing one or more
materialized views that are defined on the detail tables. The transformation is
transparent to the end user or application, requiring no intervention and no
reference to the materialized view in the SQL statement. Because query rewrite
is transparent, materialized views can be added or dropped just like indexes
without invalidating the SQL in the application code.
o
Before
the query is rewritten, it is subjected to several checks to determine whether
it is a candidate for query rewrite. If the query fails any of the checks, then
the query is applied to the detail tables rather than the materialized view.
This can be costly in terms of response time and processing power.
o
The
Oracle optimizer uses two different methods to recognize when to rewrite a
query in terms of one or more materialized views. The first method is based on
matching the SQL text of the query with the SQL text of the materialized view
definition. If the first method fails, the optimizer uses the more general method
in which it compares joins, selections, data columns, grouping columns, and
aggregate functions between the query and a materialized view.
·
Automatic
Undo Management (https://docs.oracle.com/cd/B28359_01/server.111/b28310/undo002.htm#ADMIN11461)
o
With
automatic undo management, the database manages undo segments in an undo
tablespace. Beginning with Release 11g, automatic undo management is the
default mode for a newly installed database. An auto-extending undo tablespace
named UNDOTBS1 is automatically created when you create the database
with Database Configuration Assistant (DBCA).
*10g
·
Automatic
Memory Management (https://docs.oracle.com/cd/B28359_01/server.111/b28310/memory003.htm#ADMIN11011 )
o
The
simplest way to manage instance memory is to allow the Oracle Database instance
to automatically manage and tune it for you. To do so (on most platforms), you
set only a target memory size initialization parameter
(MEMORY_TARGET) and optionally a maximum memory size
initialization parameter (MEMORY_MAX_TARGET). The instance then tunes to the
target memory size, redistributing memory as needed between the system global
area (SGA) and the instance program global area (instance PGA). Because the
target memory initialization parameter is dynamic, you can change the target
memory size at any time without restarting the database. The maximum memory
size serves as an upper limit so that you cannot accidentally set the target
memory size too high, and so that enough memory is set aside for the Oracle
Database instance in case you do want to increase total instance memory in the
future. Because certain SGA components either cannot easily shrink or must
remain at a minimum size, the instance also prevents you from setting the
target memory size too low.
·
Automatic
Segment Space Mgmt (http://www.orafaq.com/wiki/ASSM) (https://oracle-base.com/articles/9i/automatic-segment-free-space-management)
o
It
removes the need for managing freelists and freelist groups by using bitmaps to describe the space
usage of each block is within a segment. The bitmap is stored in separate
blocks known as bitmapped blocks (BMBS). This relieves the contention on the
segment header that occurs with freelists.
o
Prior
to Oracle 9i, each block had to be read so the freelist
could be checked to see if there was room in the block. In 9i, the bitmap can
be checked reducing the number of blocks read unnecessarily. The bitmap is
constantly kept up to date with changes to the block making freespace
management easier and reducing wasted space as blocks can be kept fuller since
the overhead of freelist processing has been reduced.
o
The
BMBs contain Root, Branch and Leaf blocks. This organization allows index-like
searches for free blocks. Since free blocks are no longer stored in a list it
cannot be guaranteed that contiguous blocks will be used within the segment.
For this reason the High Water Mark has been split in
two:
§
Low
High Water Mark (LHWM) - Like the old High Water Mark,
all blocks below this point have already been formatted for use.
§
High
High Water
Mark (HHWM) - Indicates the point above which no blocks have been formatted.
o
The
LHWM and the HHWM may not be the same value depending on how the bitmap tree
was traversed. If different the blocks between them may or may not be formatted
for use. The HHWM is necessary so that direct load operation can guarantee
contiguous unformatted blocks.
·
Automatic
Statistics Gathering (https://docs.oracle.com/cd/B14117_01/server.101/b10752/stats.htm#40674)
o
Oracle gathers
statistics on all database objects automatically and maintains those statistics
in a regularly-scheduled maintenance job. Automated statistics collection
eliminates many of the manual tasks associated with managing the query
optimizer, and significantly reduces the chances of getting poor execution
plans because of missing or stale statistics.
·
Automatic
Storage Management (refer to Prioritized File Recovery) (https://docs.oracle.com/cd/B28359_01/server.111/b31107/asmcon.htm#OSTMG03601)
o
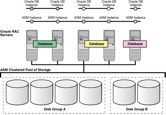
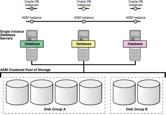
ASM
is a volume manager and a file system for Oracle database files that
supports single-instance Oracle Database and Oracle Real Application Clusters
(Oracle RAC) configurations. ASM is Oracle's recommended storage management
solution that provides an alternative to conventional volume managers, file
systems, and raw devices.
o
ASM
uses disk groups to store datafiles;
an ASM disk group is a collection of disks that ASM manages as a unit. Within a
disk group, ASM exposes a file system interface for Oracle database files. The
content of files that are stored in a disk group are evenly distributed, or
striped, to eliminate hot spots and to provide uniform performance across the
disks. The performance is comparable to the performance of raw devices.
o
You
can add or remove disks from a disk group while a database continues to access
files from the disk group. When you add or remove disks from a disk group, ASM
automatically redistributes the file contents and eliminates the need for
downtime when redistributing the content.
o
The
ASM volume manager functionality provides flexible server-based mirroring
options. The ASM normal and high redundancy disk groups enable two-way and
three-way mirroring respectively. You can use external redundancy to enable a
Redundant Array of Inexpensive Disks (RAID) storage subsystem to perform the
mirroring protection function.
o
ASM
also uses the Oracle Managed Files (OMF) feature to simplify database file
management. OMF automatically creates files in designated locations. OMF also
names files and removes them while relinquishing space
when tablespaces or files are deleted.
o
ASM
reduces the administrative overhead for managing database storage by
consolidating data storage into a small number of disk groups. This enables you
to consolidate the storage for multiple databases and to provide for improved
I/O performance.
o
ASM
files can coexist with other storage management options such as raw disks and
third-party file systems. This capability simplifies the integration of ASM
into pre-existing environments.
o
o
· Automatic Workload Repository (https://oracle-base.com/articles/10g/automatic-workload-repository-10g) (https://docs.oracle.com/database/121/RACAD/GUID-C3CD2DCE-38BD-46BA-BC32-7A28CAC9A7FD.htm#RACAD951)
o
The Automatic Workload Repository (AWR) collects, processes, and maintains
performance statistics for the database. The gathered data can be displayed in
both reports and views. If you use services with your database, then AWR
tracks metrics at the service level.
o
Metrics
can be measured against a variety of units, including time, transactions, or
database calls. For example, the number of database calls per second is a
metric. Server generated alerts can be placed on these metrics when they exceed
or fail to meet user-specified thresholds. The database or system administrator
can then respond, for example, by:
o
Using
the Oracle Database Resource Manager to configure the service level for one
service to have priorities relative to other services
o
Stopping
overloaded processes
o
Modifying
a service level requirement
o
Implementing
recovery scenarios in response to service quality changes
o
Using
AWR metrics and performance alerts enables you to maintain continued service
availability despite service level changes. It also enables you to measure the
quality of service provided by the database services.
o
The AWR
ensures that the Oracle Clusterware workload
management framework and the database resource manager have persistent and
global representations of performance data. This information helps Oracle Database
schedule job classes by service and to assign priorities to consumer groups. If
necessary, you can rebalance workloads manually with either Oracle
Enterprise Manager or SRVCTL. You can also disconnect a series of sessions, but
leave the service running.
· Automatic Diagnostic Monitor (https://oracle-base.com/articles/10g/automatic-database-diagnostic-monitor-10g) (https://docs.oracle.com/cd/B19306_01/server.102/b14211/diagnsis.htm#g41683)
o
The
Automatic Database Diagnostic Monitor (ADDM) analyzes data in the Automatic
Workload Repository (AWR) to identify potential performance bottlenecks. For
each of the identified issues it locates the root cause and provides
recommendations for correcting the problem. An ADDM analysis task is performed
and its findings and recommendations stored in the database every time an AWR
snapshot is taken provided the STATISTICS_LEVEL parameter is set
to TYPICAL or ALL. The ADDM analysis includes the following:
§
CPU
load
§
Memory
usage
§
I/O
usage
§
Resource
intensive SQL
§
Resource
intensive PL/SQL and Java
§
RAC
issues
§
Application
issues
§
Database
configuration issues
§
Concurrency
issues
§
Object
contention
o
The Automatic
Database Diagnostic Monitor (ADDM) analyzes the AWR data on a regular basis,
then locates the root causes of performance problems, provides recommendations
for correcting any problems, and identifies non-problem areas of the system.
Because AWR is a repository of historical performance data, ADDM can be used to
analyze performance issues after the event, often saving time and resources
reproducing a problem.
o
An
ADDM analysis is performed every time an AWR snapshot is taken and the results
are saved in the database. You can view the results of the analysis using
Oracle Enterprise Manager or by viewing a report in a SQL*Plus session.
o
In
most cases, ADDM output should be the first place that a DBA looks when
notified of a performance problem. ADDM provides the following benefits:
§
Automatic
performance diagnostic report every hour by default
§
Problem
diagnosis based on decades of tuning expertise
§
Time-based
quantification of problem impacts and recommendation benefits
§
Identification
of root cause, not symptoms
§
Recommendations
for treating the root causes of problems
§
Identification
of non-problem areas of the system
§
Minimal
overhead to the system during the diagnostic process
o
It
is important to realize that tuning is an iterative process and fixing one
problem can cause the bottleneck to shift to another part of the system. Even
with the benefit of ADDM analysis, it can take multiple tuning cycles to reach
acceptable system performance. ADDM benefits apply beyond production systems;
on development and test systems ADDM can provide an early warning of
performance issues.
*11g
·
Automatic
SQL Tuning (https://docs.oracle.com/cd/B28359_01/server.111/b28274/sql_tune.htm#PFGRF028)
o
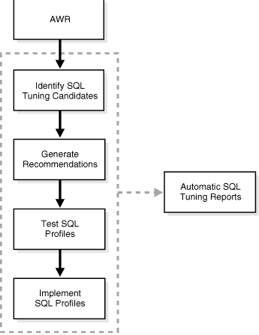
Automatic
SQL Tuning Advisor: Oracle Database automatically runs the SQL Tuning Advisor
on selected high-load SQL statements from the Automatic Workload Repository
(AWR) that qualify as tuning candidates. This task, called Automatic SQL
Tuning, runs in the default maintenance windows on a nightly basis. You can
customize attributes of the maintenance windows, including start and end time,
frequency, and days of the week.
o
·
Automatic
Workload Capture/Replay (https://docs.oracle.com/cd/B28359_01/server.111/e12253/dbr_intro.htm#BABBDGIB)
o
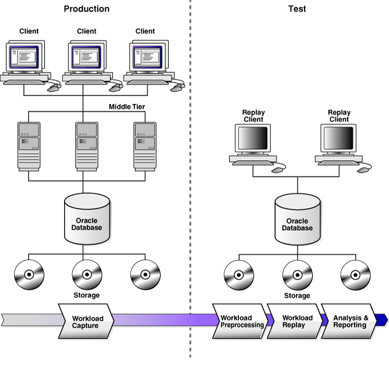
You
can use Database Replay to capture a workload on the production system and
replay it on a test system with the exact timing, concurrency, and transaction
characteristics of the original workload. This enables you to test the effects
of a system change without affecting the production system.
o
o
When
workload capture is enabled, all external client requests directed to Oracle
Database are tracked and stored in binary files—called capture files—on
the file system. You can specify the location where the capture files will be
stored. Once workload capture begins, all external database calls are written
to the capture files. The capture files contain all relevant information about
the client request, such as SQL text, bind values, and transaction information.
Background activities and database scheduler jobs are not captured. These
capture files are platform independent and can be transported to another
system.
o
After
a captured workload has been preprocessed, it can be replayed on a test
system. During the workload replay phase, Oracle Database performs the actions
recorded during the workload capture phase on the test system by re-creating
all captured external client requests with the same timing, concurrency, and
transaction dependencies of the production system.
o
Database
Replay uses a client program called the replay client to re-create all
external client requests recorded during workload capture. Depending on the
captured workload, you may need one or more replay clients to properly replay
the workload. A calibration tool is provided to help determine the number of
replay clients needed for a particular workload. Because the entire workload is
replayed—including DML and SQL queries—the data in the replay system should be
as logically similar to the data in the capture system as possible. This will
minimize data divergence and enable a more reliable analysis of the replay.
·
Automatic
SQL Plan Management (https://www.oracle.com/technetwork/database/bi-datawarehousing/twp-sql-plan-management-11gr2-133099.pdf )
o
SQL
Plan Management (SPM) provides a framework for completely transparent
controlled execution plan evolution. With SPM the
optimizer automatically manages execution plans and ensures only known or
verified plans are used. When a new plan is found for a SQL statement it will
not be used until it has been verified by the database to have comparable or
better performance than the current plan.
o
SQL
plan management (SPM) ensures that runtime performance will never degrade due
to the change of an execution plan. To guarantee this, only accepted (trusted)
execution plans will be used; any plan evolution will be tracked and evaluated
at a later point in time and only be accepted as verified if the new plan
causes no runtime change or an improvement of the runtime.
o
The
SQL Plan Management has three main components:
§
1.
SQL plan baseline capture: Create SQL plan baselines that represents accepted
(trusted) execution plans for all relevant SQL statements. The SQL plan
baselines are stored in a plan history in the SQL Management Base in the SYSAUX
tablespace.
§
2.
SQL plan baseline selection: Ensure that only accepted execution plans are used
for statements with a SQL plan baseline and track all new execution plans in
the plan history for a statement. The plan history consists of accepted and
unaccepted plans. An unaccepted plan can be unverified (newly found but not
verified) or rejected (verified but not found to performant).
§
3.
SQL plan baseline evolution: Evaluate all unverified execution plans for a
given statement in the plan history to become either accepted or rejected.
o
With
automatic plan capture enabled, the SPM repository will be automatically
populated for any repeatable SQL statement.
·
Automatic
Capture of SQL Monitor (https://docs.oracle.com/database/121/TGSQL/tgsql_monit.htm#TGSQL790)
o
Real-Time
SQL Monitoring, which was introduced in Oracle Database 11g, enables you
to monitor a single SQL statement or PL/SQL procedure. Starting in Oracle
Database 12c, Real-Time Database Operations provides the ability to
monitor composite operations automatically. The database automatically monitors
parallel queries, DML, and DDL statements as soon as execution begins. By
default, Real-Time SQL Monitoring automatically starts when a SQL statement
runs in parallel, or when it has consumed at least 5 seconds of CPU or I/O time
in a single execution.
o
By
default, AWR automatically captures SQL monitoring reports in XML format. The
reports capture only SQL statements that are not executing or queued and have
finished execution since the last capture cycle. AWR captures reports only for
the most expensive statements according to elapsed execution time.
o
The
Monitored SQL Executions page in Enterprise Manager Cloud Control (Cloud
Control) summarizes the activity for monitored statements. You can use this
page to drill down and obtain additional details about particular statements.
·
Automatic
Data Optimization (https://docs.oracle.com/database/121/VLDBG/GUID-59C132D6-D36B-4B5E-B0CA-948C1B0E6836.htm#VLDBG14117)
o
To
implement your ILM strategy, you can use Automatic Data Optimization (ADO) to
automate the compression and movement of data between different tiers of
storage within the database. The functionality includes the ability to create
policies that specify different compression levels for each tier, and to
control when the data movement takes place.
o
You
can specify policies for ADO at the row, segment, and tablespace level when
creating and altering tables with SQL statements. By specifying policies for
ADO, you can automate data movement between different tiers of storage within
the database. These policies also enable you to specify different compression
levels for each tier, and to control when the data movement takes place.
·
Active Stand By/Data Guard(https://oracle-base.com/articles/11g/data-guard-setup-11gr2)
(https://www.oracle.com/database/technologies/high-availability/dataguard.html)
o
Data
Guard is the name for Oracle's standby database solution, used for disaster
recovery and high availability.
*12c
· Autonomous Health Framework (https://www.oracle.com/database/technologies/rac/ahf.html) (https://www.oracle.com/technetwork/database/options/clustering/ahf/learnmore/oracle-ahf-faqs-4392561.pdf)
o
Oracle
Autonomous Health Framework (AHF) presents the next generation of tools as
components, which work together autonomously 24x7 to keep database systems
healthy and running while minimizing human reaction time. Utilizing applied
machine-learning technologies, Oracle AHF provides early warnings or
automatically solves operational runtime issues faced by Database and System
administrators in the areas of availability and performance.
o
Oracle
AHF preserves availability of your
database system during both software (DB, GI, OS) and hardware (CPU, network,
memory, storage) issues by:
§
Providing
early warnings for potential availability issues
§
Identifying
underlying cause and recommended actions for quick resolution
§
Gathering
relevant and complete diagnostics for efficient triage by Oracle Support
Services
o
Availability
issues include those due to memory stress, runaway queries, hangs, DoS attacks, rogue workloads, software bugs, software
configuration and file permission changes.
o
Oracle
AHF maintains performance during
both software issues (bugs, configuration, contention, etc.) and client issues
(demand, queries, connection management, etc.) by:
§
Providing
early warnings for potential performance degradation issues
§
Detecting
hung sessions and automatically resolving them
§
Identifying
bottlenecked resources (storage, global cache, CPU or SQL)
§
Re-allocating
resources to maintain SLAs and performance objectives
o
Performance
issues include those due to deviations from best practices, misconfigured
parameters, software bugs, oversubscribed resources, and excessive demand
relative to server or database capacity.
o
The
Oracle RAC Family of Solutions
refers to the collection of products and features that licensed Oracle RAC or
Oracle RAC One Node customers can use free of additional charge. Each solution
either enhances or complements the core Oracle RAC offering by ensuring better
high availability and scalability or by automating and simplifying day-to-day
operation
o
Autonomous
in Oracle Autonomous Health Framework refers to the fact that the components in
the framework require minimal human intervention to do their work. They run
24x7 in their daemon mode to resolve the operational runtime issues in the
database system in the space of availability and performance. These components
of Oracle AHF include Cluster Health Monitor (CHM), ORAchk,
Cluster Verification Utility (CVU), Cluster Health Advisor (CHA), Trace File
Analyzer (TFA), Quality of Service Management (QoSM),
Hang Manager, and Memory Guard.
· Automatic Diagnostic Framework (https://docs.oracle.com/cd/E17904_01/core.1111/e10105/diagnostics.htm#ASADM11143)
o
The
problems that are targeted in particular are critical errors such as those
caused by code bugs, metadata corruption, customer data corruption, deadlocked
threads, and inconsistent state.
o
When
a critical error occurs, it is assigned an incident number, and diagnostic data
for the error (such as log files) are immediately captured and tagged with this
number. The data is then stored in the Automatic Diagnostic Repository (ADR),
where it can later be retrieved by incident number and analyzed.
o
The
goals of the Diagnostic Framework are:
§
First-failure
diagnosis
§
Limiting
damage and interruptions after a problem is detected
§
Reducing
problem diagnostic time
§
Reducing
problem resolution time
§
Simplifying
customer interaction with Oracle Support
o Automatic capture of diagnostic data
upon first failure, Standardized log formats, Diagnostic rules, Incident
detection log filter, Incident packaging service(IPS) and incident packages,
Integration with WebLogic Diagnostics Framework (WLDF)
o
The Automatic
Diagnostic Repository (ADR) is a file-based hierarchical repository for Oracle
Fusion Middleware diagnostic data, such as traces and dumps. The Oracle Fusion
Middleware components store all incident data in the ADR. Each Oracle WebLogic
Server stores diagnostic data in subdirectories of its own home directory
within the ADR. For example, each Managed Server and Administration Server has
an ADR home directory.
·
Automatic
Refresh of Clones (https://oracle-base.com/articles/12c/multitenant-pdb-refresh-12cr2)
o
A database clone
is a complete and separate copy of a database system that includes the business
data, the DBMS software and any other application tiers that make up
the environment. Cloning is a different kind of operation to replication and backups in
that the cloned environment is both fully functional and separate in its own
right. Additionally, the cloned environment may be modified at its inception
due to configuration changes or data subsetting.
o
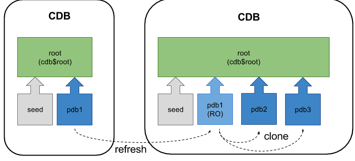
From
Oracle Database 12.2 onward it is possible to refresh the contents of a
remotely hot cloned PDB provided it is created as a refreshable PDB and has
only ever been opened in read only mode. The read-only PDB can be used for
reporting purposes, or as the source for other clones, to minimise
the impact on a production system when multiple up-to-date clones are required
on a regular basis.
o
o
Automatic Refresh
Mode
·
Sharding
(https://docs.oracle.com/en/database/oracle/oracle-database/12.2/admin/sharding-overview.html#GUID-0F39B1FB-DCF9-4C8A-A2EA-88705B90C5BF)
(https://www.oracle.com/database/technologies/high-availability/sharding.html)
o
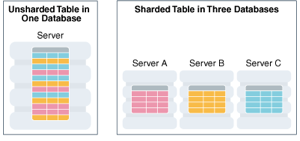
Sharding is
a data tier architecture in which data is horizontally partitioned across
independent databases.
o
Each database is hosted on dedicated
server with its own local resources - CPU, memory, flash, or disk. Each
database in such configuration is called a shard.
All of the shards together make up a single logical database, which is referred
to as a sharded database (SDB).
o
Horizontal partitioning involves
splitting a database table across shards so that each shard contains the table
with the same columns but a different subset of rows. A table split up in this
manner is also known as a sharded
table.
o
o
Sharding
is based on shared-nothing hardware infrastructure and it eliminates single
points of failure because shards do not share physical resources such as CPU,
memory, or storage devices. Shards are also loosely coupled in terms of
software; they do not run clusterware.
o
Shards are typically hosted on
dedicated servers. These servers can be commodity hardware or engineered
systems. The shards can run on single instance or Oracle RAC databases. They
can be placed on-premises, in a cloud, or in a hybrid on-premises and cloud
configuration.
o
From the perspective of a database
administrator, an SDB consists of multiple databases that can be managed either
collectively or individually. However, from the perspective of the application,
an SDB looks like a single database: the number of shards and distribution of
data across those shards are completely transparent to database applications.
o
Sharding
is intended for custom OLTP applications that are suitable for a sharded database architecture. Applications that use sharding must have a well-defined data model and data
distribution strategy (consistent hash, range, list, or composite) that
primarily accesses data using a sharding key.
Examples of a sharding key include customer_id, account_no,
or country_id.
·
Multitenancy (https://www.oracle.com/database/technologies/multitenant.html)
(https://docs.oracle.com/database/121/CNCPT/cdbovrvw.htm#CNCPT89234)
o
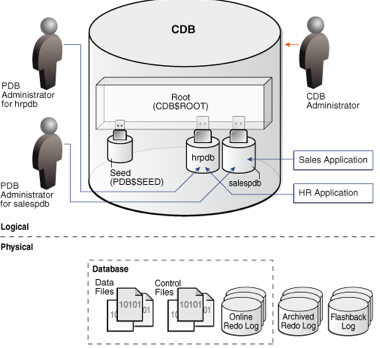
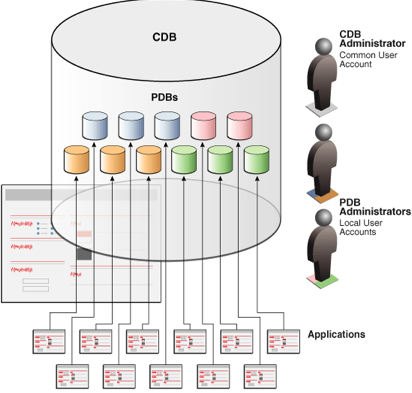
The multitenant architecture enables
an Oracle database to function as a multitenant container database (CDB).
o
A CDB includes zero, one, or many
customer-created pluggable databases (PDBs). A PDB is a portable collection of
schemas, schema objects, and nonschema objects that
appears to an Oracle Net client as a non-CDB. All Oracle databases before Oracle
Database 12c were non-CDBs.
o
o
*18c
·
Automatic
Columnar Flash (refer to In-Memory Columnar in Flash) (https://static.rainfocus.com/oracle/oow18/sess/1523720875201001bowD/PF/Exadata%20OOW%202018_1540521672709001DFBX.pdf)
o
Exadata
Brings In-Memory Analytics to Storage:
§
With
Exadata Flash throughput approaching memory
throughput, SQL bottleneck moves from I/O to CPU
§
Exadata
automatically transforms table data into In-Memory DB columnar formats in Exadata Flash cache – Enables fast vector processing for
storage server queries
§
Uniquely
optimizes next generation Flash as memory – Now works for both row format OLTP
databases, and Hybrid Columnar Compressed Analytics databases
·
Automatic
IM population (https://blogs.oracle.com/in-memory/automatic-in-memory)
o
Automatic
In-Memory (AIM) was introduced as part of Database In-Memory in Oracle Database
18c and allows automatic management of the contents of the IM column store.
This feature builds on the underlying data of Heat Map, a feature introduced
with Automatic Data Optimization (ADO) in Oracle Database 12.1.
o
When
AIM is enabled, if the size of the objects that have been enabled for in-memory
exceeds the size of the IM column store then the least active populated
object(s) will be evicted to make room for more frequently accessed in-memory
enabled objects. The really cool part of this is that AIM uses access tracking,
column and other relevant statistics to determine which are the least active
objects. No guessing required!
o
Key
to the function of AIM is the concept of "memory pressure". AIM will
only kick in when there is not enough space to populate the object. Prior to
AIM, it is possible to run out of IM column store space when populating an
object. The great thing about Database In-Memory is that even if an object is
only partially populated, queries that access the object in the
IM column store won't fail. They will access the portion of data that is
populated and then get the rest of the column data from the row-store.
Obviously, this is not going to provide the best performance and that's where
AIM kicks in.
o
With
AIM enabled that object can be fully populated because one or more objects with
the least activity will be evicted to make room.
· Automatic Application Continuity (https://docs.oracle.com/en/database/oracle/oracle-database/18/racad/ensuring-application-continuity.html#GUID-C1EF6BDA-5F90-448F-A1E2-DC15AD5CFE75)
o
Application
Continuity masks many recoverable database outages (when replay is successful)
from applications and users by restoring the database session: the full
session, including all states, cursors, variables, and the last transaction if
there is one.
o
Application
Continuity addresses the problem that arises when an application is trying to
access the database and the database instance becomes unavailable due to an
unplanned or planned outage (timeout, network outage, instance failure, repair,
configuration change, patch apply, and so on). Without Application Continuity
in place, database recovery does not mask outages to applications and end
users. In such scenarios, developers and users must cope with exception
conditions, and users can be left not knowing what happened to their funds
transfers, time sheets, orders, bill payments, and so on. Users might lose
screens of uncommitted data, and must log in again and reenter that data. In
the worst cases, the administrator might be forced to restart the middle tier
to recover from an overwhelming number of logins.
o
With
Application Continuity, if the database instance became unavailable, then
Application Continuity attempts to rebuild the session and any open
transactions using the correct states; and if the transaction committed and
need not be resubmitted, then the successful return status is returned to the
application. If replay is successful, then the request can continue safely
without risk of duplication. If replay cannot restore data that the application
has already processed and potentially made decisions on, then the database
rejects the replay and the application receives the original error.
o
Application
Continuity performs the recovery of in-flight transactions and database session
state, while ensuring the transaction idempotence
provided by Transaction Guard. Each database session is tagged with a logical
transaction ID (LTXID), so the database recognizes whether each replay
committed any transactions, and if it did commit any transactions, whether the
work also ran to completion. While Application Continuity attempts to replay,
the replay appears to the application as a delayed execution, or the
application receives the commit response for the original transaction (if the
last transaction had completed before the outage).
*19c
· Fast ingest support for IoT type workloads
·
Improvements
for count distinct and group by queries
·
Sharding
now supports multiple PDB shards in a CDB
·
SQL
JSON Enhancements
·
Partial
JSON Update support
o

·
RAT
and ADDM at PDB level